Data Visualizer Module
The Data Visualizer module in the Develop workspace is a condensed version of the same module in the Visualize workspace. You can use it to configure, collect, and look at data from the controller and also set the rate at which data collection occurs. You can also save, open, and look at plot files.
IMPORTANT: All the features and functionality of the Data Visualizer module are the same in the Develop workspace and the Visualize workspace. If you want to do work with a larger version of the Data Visualizer module in the Visualize workspace, see Visualize Workspace.
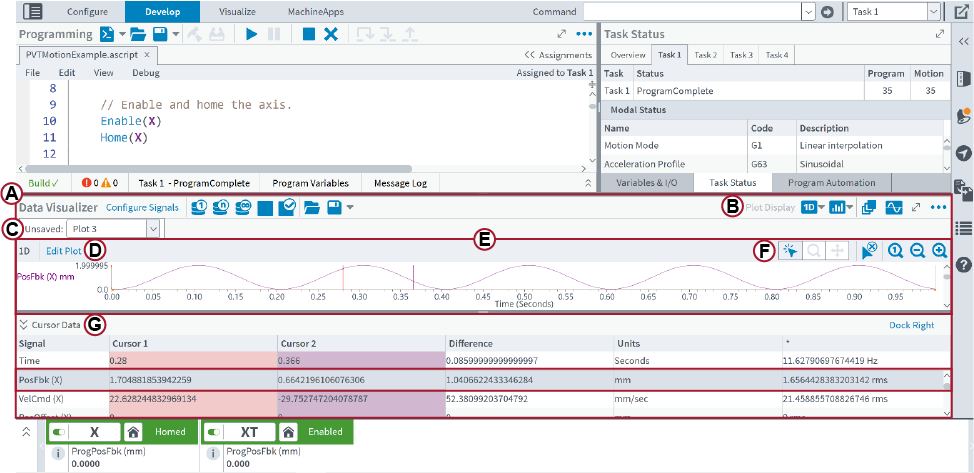
Figure: Data Visualizer Module in the Develop Workspace
 Data Visualizer Toolbar
| Name | Type | Description |
|---|---|---|
|
Configure Signals |
Link |
Opens the Configure Signals dialog. Use this dialog to configure the data that you want to collect. For more information, see the Configure Signals Dialog sections of 1D Data Collection, 2D Data Collection, and 3D Data Collection. |
|
Collect Snapshot |
Button |
Collects one snapshot of data. The application shows the collection percentage and then shows the downloading percentage. When all of the points are downloaded, the application shows the data on the plot. Because Studio can start downloading data while the controller is still collecting data points, the download percentage does not always start at zero. |
|
Collect Repeated Snapshots |
Button |
Collects consecutive snapshots of data until you stop data collection. The data for each snapshot shows on the plot after all of the data points are collected for that snapshot. Each snapshot will overwrite the plot data from the previous snapshot. |
|
Collect Continuous |
Button |
Continuously collects and shows data on the plot. By default, only a quantity of time that is equal to the Time to Collect will show on the plot. The Time to Collect is the time that you specify in the Configure Signals dialog. |
|
Stop Collection |
Button |
Stops data collection immediately. |
| Stop Collection After Completion |
Button |
Stops data collection after the controller collects all of the data for the current snapshot. |
|
Open File |
Button |
Opens a saved plot file (.plt) or .dat file from the Windows file system or Controller File System. A .dat file contains sampled data from an AeroScript program or library. See Data Collection Functions and Start and Stop Data Collection for information about how to use the |
|
Save File |
Button |
Save - Saves your plot to the Windows file system. When you save a plot, the application moves it from the Unsaved plots drop-down box to a plot file tab. |
|
Save As - Saves your plot as a CSV (comma-separated values) file. You cannot open a CSV file in the Data Visualizer module.
Tip: You can also save your plot as a plot file by selecting Plot Files (*.plt). |
 . Then select
 IMPORTANT: During continuous data collection, the application might collect more than the specified number of points. This can occur because the application collects a minimum of 100 ms of data for performance reasons. For example, let's say that you are using a data collection rate of 20 kHz. The application will collect a minimum of 2,000 points, which corresponds to 100 ms worth of data.
 Plot Display Toolbar
| Name | Type | Description |
|---|---|---|
| Plot Display |
Drop-Down Box |
Lets you look at all of the plots as 1D, 2D, or 3D. You can also look at overlapped plots and Fourier transforms. |
|
1D - Shows the 1D data signals that the plot contains. |
||
|
2D - Shows the 2D data signals that the plot contains. |
||
|
3D - Shows the 3D data signals that the plot contains. |
||
|
1D/2D - Shows the 2D and 1D data signals that the plot contains. The 2D data signals are shown in a plot above the 1D data signals. In this view, when you put a cursor on the 2D plot, one is automatically added to the corresponding point in the 1D plot. If you put a cursor on the 1D plot, one is automatically added to the corresponding point in the 2D plot. |
||
|
1D/3D - Shows the 3D and 1D data signals that the plot contains. The 3D data signals are shown in a plot above the 1D data signals. In this view, when you put a cursor on the 3D plot, one is automatically added to the corresponding point in the 1D plot. If you put a cursor on the 1D plot, one is automatically added to the corresponding point in the 3D plot. |
||
|
Surface Plot - Shows the 3D data signals that the plot contains as a 3D surface plot. |
||
|
FFT - When you compute a Fourier transform, the application adds a plot for each data signal that you selected to the Plot Display drop-down box. The name of the Fourier transform plot includes the name of the data signal and the axis that you used to compute it. For more information, see Compute Fourier Transforms. |
||
|
Overlap Plot - Shows the 1D data signals of the currently selected plot overlapped with the 1D data signals of a different plot that you selected. You can overlap plots by using the Overlap Plots button in the Data Visualizer toolbar. |
||
|
To Remove Plots - Click the X that is adjacent to the plot name to remove it from the Plot Display drop-down box. |
||
| Plot Options |
Drop-Down Box |
Use the Plot Options drop-down to change how the application shows data for all of the plots, including which units are used. |
|
Display Zero Lines - When you use this view of a 1D plot, a horizontal line is drawn over each data signal at Y = 0. |
||
|
Display Grid Lines - When applicable, this view shows dashed grid lines at the major plot-axis tick marks. |
||
|
Display Data Points - When applicable, this view shows collected data as circular points on the plot. |
||
|
Signal Units - Shows data signals that contain position information on the Y-axis part of the plot. For more information about signal units, see Working with Plots. |
||
|
Time Units - Shows data signals that contain time information on the X-axis part of the plot. For more information about time units, see Working with Plots. |
||
|
Overlap Signals Options - Determines how to overlap the 1D data signals of a plot. When None is selected, the 1D data signals are not be overlapped. When Overlap All is selected, all the 1D data signals are overlapped. When Overlap By Axis is selected, data signals are grouped according to which axis they were collected from and then overlapped. When Overlap By Signal is selected, data signals are grouped according to their signal name and then overlapped. |
||
| Overlap Plots |
Button |
The Overlap Plots dialog comes into view. Use this dialog to select one or more plots to overlap with the plot that you currently have in view. When you click OK on the Overlap Plots dialog, a new overlapped plot is added to the Plot Display drop-down, and the new plot is automatically selected. The plot shows all of the data signals from the current and selected plots, grouped by context. |
|
Compute FFT |
Button |
Computes the Fourier transform of one or more of the data signals that are on the plot. When you click this button, the Compute Fourier Transform dialog comes into view and lets you select the data signals and options for the Fourier transform. For more information about this dialog, see Compute Fourier Transforms. |
|
Menu |
Button |
You can find more settings for the Data Visualizer module. To do this, select the Menu |
 button. Then click
 Unsaved Plots Tab
This tab shows unsaved plot data. Each time you collect data, a new plot is added to the list in the Unsaved Plots drop-down box. To remove a plot from the Unsaved Plots list, click the X that is adjacent to the plot name.
 Edit Plot Link
The Edit Plot link opens the Edit Plot dialog. The Edit Plot dialog lets you look at and change how the selected plot shows the collected data signals. For information about how to edit a plot, see the Editing Plots section of the Working with Plots page.
 Data Visualizer
Shows the plots and shapes that you can make from the data signals that you configure and collect in the application.
 Plot Viewing Options
| Name | Type | Description |
|---|---|---|
|
Place Cursors |
Button |
Use the left and right mouse buttons to put cursors on the plot that you are looking at. When you look at the 1D/2D plot, putting a cursor on one of the plots automatically puts a corresponding cursor on the other plot. To see the cursor values, expand the Cursor Data drawer on the bottom-left or the right-hand side of the module. Click the Dock Right or Dock Bottom link to change the location of the Cursor Data drawer. Click the Clear Cursors button to remove all of the cursors from the plot that you are looking at. |
|
Zoom |
Button |
Zooms in on a range of data when you use the left mouse button to click and drag on the plot. |
|
Pan |
Button |
Changes the range of data that you are looking at when you use the left mouse button to click and drag on the plot. |
|
Rotate |
Button |
Click and drag the left mouse button to rotate the 3D camera around the point of focus. This option is available only for 3D plots. |
|
Clear Cursors |
Button |
Removes all of the cursors from the plot that you are looking at. Also removes all of the data from the Cursor Data drawer. |
|
Reset Zoom |
Button |
Resets the zoom level on the plot that you are looking at. |
|
Zoom Out |
Button |
Decreases the zoom level on the plot that you are looking at. |
|
Zoom In |
Button |
Increases the zoom level on the plot that you are looking at. |
 Cursor Data Drawer
| Name | Type | Description |
|---|---|---|
|
Signal |
Column |
Shows the data signals that you selected for each axis in the Configure Signals dialog. |
|
Cursor 1 |
Column |
Cursor value for the left mouse button that you get when you use the Place Cursors button. |
|
Cursor 2 |
Column |
Cursor value for the right mouse button that you get when you use the Place Cursors button. |
|
Difference |
Column |
Shows the difference between the data for Cursor 1 and Cursor 2. |
|
Units |
Column |
Shows the units of a data signal. To change these units, you must change the Signal Units and Time Units in the Plot Options drop-down box. For information about how to do this, see Working with Plots. |
|
* |
Column |
For the Time row of 1D plots, this column shows the frequency in Hertz of the period of time between Cursor 1 and Cursor 2. For 1D data signals that were collected from the controller, this column shows the Root Mean Squared value of the data set between Cursor 1 and Cursor 2. For 2D and 3D data signals, this column shows the vector difference between the point on which Cursor 1 is put and the point on which Cursor 2 is put. |
|
Dock Right |
Link |
Changes the location of the Cursor Data Drawer to the right-hand side of the module. |
|
Dock Bottom |
Link |
Changes the location of the Cursor Data Drawer to the bottom-left part of the module. |
Changing the Module Layout
You can change the size of the module when you click and drag the border with other modules in the workspace.
In the top-right part of the module header, click the Expand button  to let the module fill all of the workspace area. While it is expanded, you can click the Restore button
  to let the module go back to its original size.
More Reading
For more information about how to collect data in the Data Visualizer module, see the pages that follow:
You can also use the Application Data Collection Functions to configure and collect 1D data signals from AeroScript.
You can configure and collect 2D data only in the Data Visualizer module. But after data collection is configured, you can use the Application Data Collection Functions to do some operations in AeroScript.
You can configure and collect 3D data only in the Data Visualizer module. But after data collection is configured, you can use the Application Data Collection Functions to do some operations in AeroScript.
Programmatically collect and write plot files to the controller file system from AeroScript.
In the Motion Health® module, you can use Signal Log to continuously collect diagnostic data and monitor it for Signal Log trigger events.
Configure, edit, and interact with plots. You can add signals to plots, make custom changes to the signals, and change the signal and time units.
Compute the Fourier transform of one or more of the signals that are on a plot.


