Working with Plots
After you collect a plot, you can interact with it and customize it. You can configure the parts of the plot that follow:
- The units of data signals that depend on distance or time
- The colors of data signals
- Which data signals to show or hide on the plot
- Custom scale factors and offsets for plots
- Add 2D or 3D data signals by using the 1D data signals that are on the plot
For information about how to configure these items, refer to the sections that follow.
Signal Units
The signal unit that you select determines the units of signals that depend on distance, such as Position Command or Velocity Command. The signal names on the Y-axis part of the plot show the signal unit in a formula that identifies the scale factor, if applicable.
Signal units can be one of the units that follow:
- Primary units
- Secondary units
- Counts
- One of the above units multiplied by a number (type: double)
- One of the above units divided by a number (type: double)
If you want to see the plot results on a scale that is more applicable to your application, you can change the Signal Units of the plot. These units apply to all of the data signals on the current plot and data signals that are sourced from overlapped plots.
- In Automation1 Studio, select the Visualize tab.
- On the Plot Display toolbar, click the Plot Options arrow and hold the pointer over Signal Units. The Signal Units list comes into view.
- If you want to use Primary units or Counts, select the applicable unit.
- If you want to use a different unit, select Add new unit. In the Custom Unit Scale dialog, do the steps that follow:
- In the Unit Type box, select the basic unit that you want to use. This will identify the resulting unit as a factor of Primary units, Secondary units, or Counts.
- In the Operator box, select if the new unit should be multiplied or divided by the scale factor.
- In the Scale Factor box, enter the factor you want to use. Then click OK. The new unit is automatically applied as the Signal Unit.
To remove a data signal unit from the Signal Units list, click the X that is adjacent to the unit you want to remove.
For more information about data signals, see Controller Motion Signals. For more information about units, see Position, Velocity, and Acceleration Units on the Motion Setup Functions page.
Time Units
The time unit that you select determines the units of signals that depend on time, such as Velocity Command or Acceleration Command. It also determines the units of the X-axis part of the plot.
Time units can be one of the units that follow:
- Milliseconds
- Seconds
- Minutes
If you want to see the plot results on a scale that is more applicable to your application, you can change the Time Units of the plot. These units apply to all of the data signals on the current plot and data signals that are sourced from overlapped plots.
- In Automation1 Studio, select the Visualize tab.
- On the Plot Display toolbar, click the Plot Options arrow and hold the pointer over Time Units. The Time Units list comes into view.
- Select the unit that you want to use.
For more information about data signals, see Controller Motion Signals. For more information about units, see Position, Velocity, and Acceleration Units on the Motion Setup Functions page.
Interacting with the Plot
To change the zoom level on the plot that you are looking at, use the Zoom In, Zoom Out, and Reset Zoom buttons.
To change the action when you click on a plot, use the Mouse Button selector. It has the options that follow:
- Place Cursors - Use the left and right mouse buttons to put cursors on the plot that you are looking at. When you look at the 1D/2D plot, putting a cursor on one of the plots automatically puts a corresponding cursor on the other plot. To see the cursor values, expand the Cursor Data drawer on the bottom-left or the right-hand side of the module. Click the Dock Right or Dock Bottom link to change the location of the Cursor Data drawer. Click the Clear Cursors button to remove all of the cursors from the plot that you are looking at.
- Zoom - Zooms in on a range of data when you use the left mouse button to click and drag on the plot.
- Pan - Changes the range of data that you are looking at when you use the left mouse button to click and drag on the plot.
- Rotate - Click and drag the left mouse button to rotate the 3D camera around the point of focus. This option is available only for 3D plots.
In addition to the Visualize workspace buttons, you can also interact with plots by doing the options that follow:
- To zoom in and out of the plot, press the Ctrl (Control) key and use the mouse scroll wheel.
- To pan on the plot, click and drag the mouse scroll wheel.
Editing Plots
The Edit Plot link opens the Edit Plot dialog. The Edit Plot dialog lets you look at and change how the selected plot shows the collected data signals. You can show or hide data signals, change the properties of a data signal, and add or remove multidimensional data signals. You can also overwrite your currently configured data signals with the data signals that the plot collected. When you overwrite your currently configured data signals, the data signals in the Configure Signals dialog become the same as the data signals that are in the Edit Plot dialog.
IMPORTANT: You might see more data signals in the Edit Plot dialog that you did not configure in the Configure Signals dialog. These are derived signals that are calculated from the data signals that you collected. Derived signals are not shown on a plot by default.
- In Automation1 Studio, select the Visualize tab.
- On the plot that you select, click the Edit Plot link.
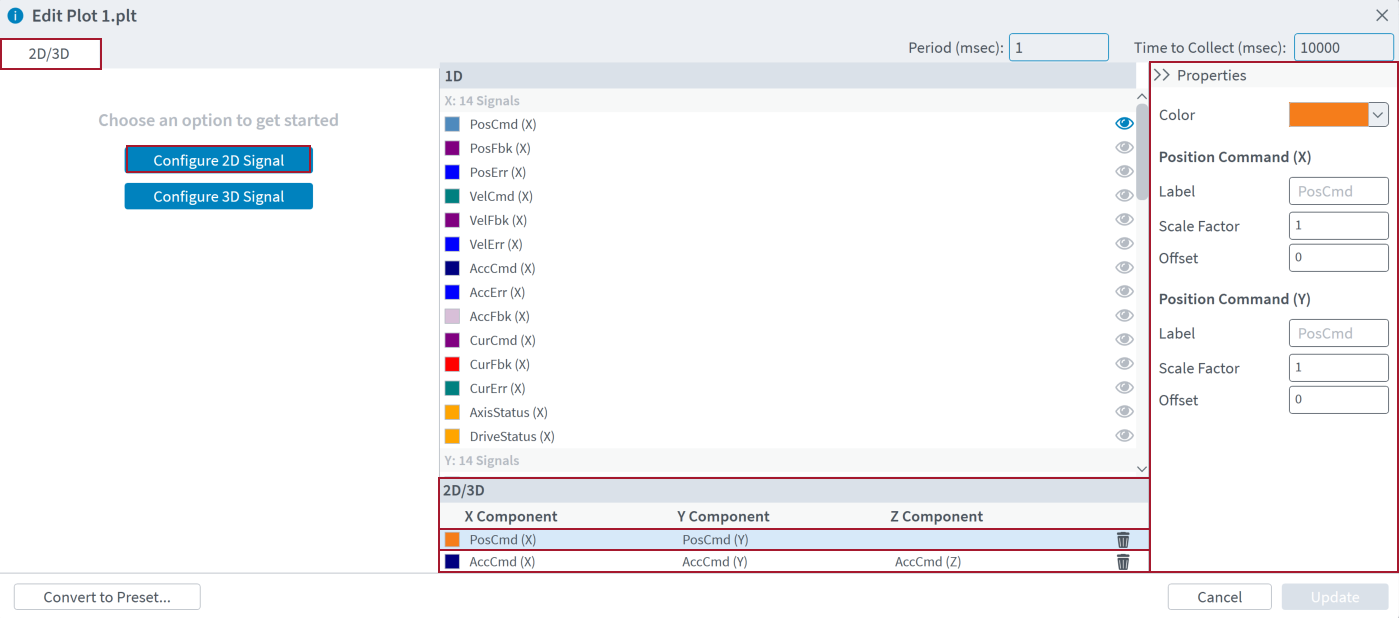
- In the Edit Plot dialog, select the 2D/3D tab.
- In the Choose an option to get started part of the dialog, click the Configure 2D Signal button.
- Follow the prompts to configure the X and Y components of the 2D signal and add it to your 2D signals.
- Click the Update button to save your changes and close the dialog.
IMPORTANT: You can select only an existing 1D data signal as a component for a 2D signal. You cannot add new 1D signals that were not collected during data collection.
- In Automation1 Studio, select the Visualize tab.
- On the plot that you select, click the Edit Plot link.
- In the Edit Plot dialog, select the 2D/3D tab.
- In the Choose an option to get started part of the dialog, click the Configure 3D Line Plot or the Configure 3D Surface Plot button.
- Follow the prompts to configure the X, Y, and Z components of the 3D signal and add it to your 3D signals.
- Click the Update button to save your changes and close the dialog.
IMPORTANT: You can select only an existing 1D data signal as a component for a 3D signal. You cannot add new 1D signals that were not collected during data collection.
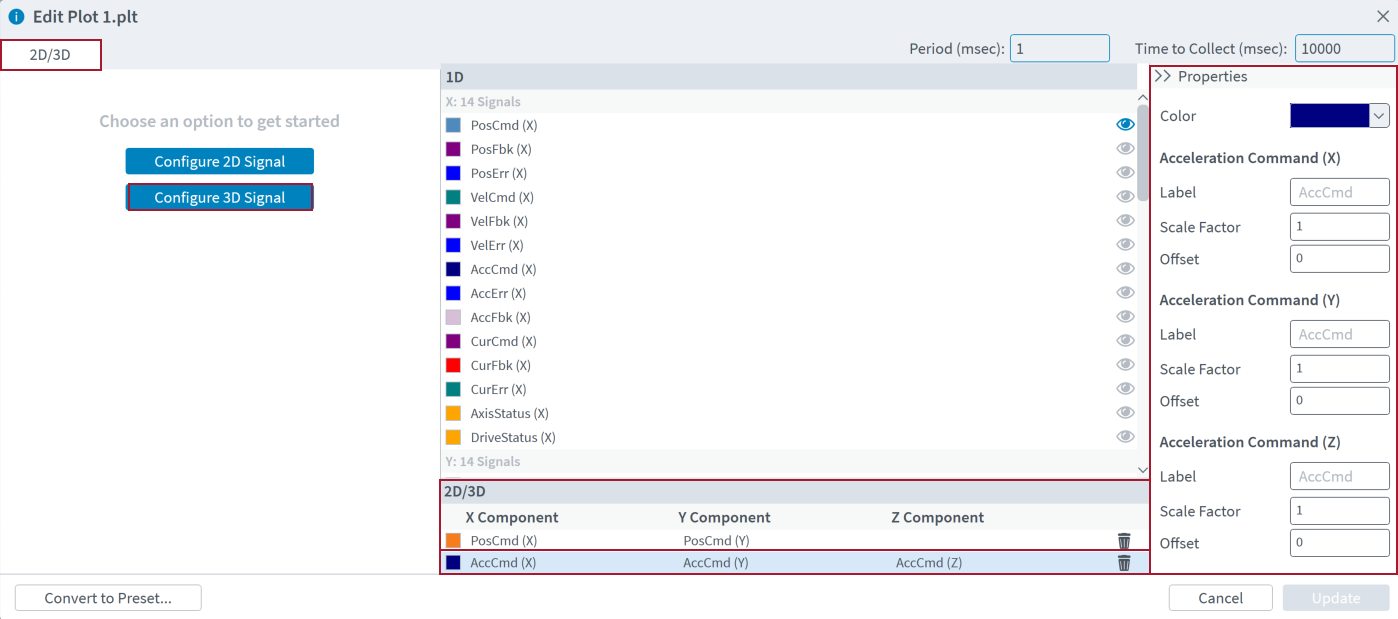
Table: Edit Plot Dialog
| Name | Type | Description |
|---|---|---|
|
2D/3D |
Pane |
Shows the buttons that you can use to add 2D or 3D data signals to your plot. |
|
Button |
Configure 2D Signal - Lets you configure a new 2D data signal and add it to your plot. |
|
|
Button |
Configure 3D Signal - Lets you configure a new 3D data signal and add it to your plot. |
|
|
1D |
Pane |
Shows a list of the 1D data signals that were collected. |
|
Button |
Display Signal on Plot - Shows or hides a data signal on the plot. |
|
|
2D/3D |
Pane |
Shows a list of the 2D and 3D data signals that you configured. |
|
Column |
X Component - Shows the axes and data signals that you select for the X-axis part of the plot. |
|
|
Column |
Y Component - Shows the axes and data signals that you select for the Y-axis part of the plot. |
|
|
Column |
Z Component - Shows the axes and data signals that you select for the Z-axis part of the plot. This applies only to 3D plots. |
|
|
Button |
Delete Signal - Deletes a data signal from the 2D/3D signals list. |
|
|
Properties |
Column |
Shows the properties that you can change for each configured data signal. |
|
Drop-Down Box |
Color - Shows the data signal color. You can select a new signal color from the drop-down box. To make a signal color with specific RGB, HSL, or CMYK options, select the Color drop-down box. Then click Advanced. |
|
|
Text Box |
Label - Shows the name of the data signal. You can change it to a different name. |
|
|
Text Box |
Scale Factor - The value to multiplicatively apply to the collected data. If you specify a Scale Factor and an Offset, the Offset is applied before the Scale Factor. |
|
|
Text Box |
Offset - The value to add to the collected data. If you specify a Scale Factor and an Offset, the Offset is applied before the Scale Factor. |
|
|
Convert to Preset... |
Button |
Converts the configured data signals in your plot to a data collection preset and saves it to the controller. IMPORTANT: The application will not add Industrial Ethernet signals from the plot configuration to the preset. |
|
Cancel |
Button |
Clears your unsaved changes from the Edit Plot dialog and asks you to confirm the action. |
|
Update |
Button |
Saves your current changes to the Edit Plot dialog and then closes it. IMPORTANT: This action also saves changes to your plot file. |


