You are here: Glossary > Frequency Response Measurement
Frequency Response Measurement
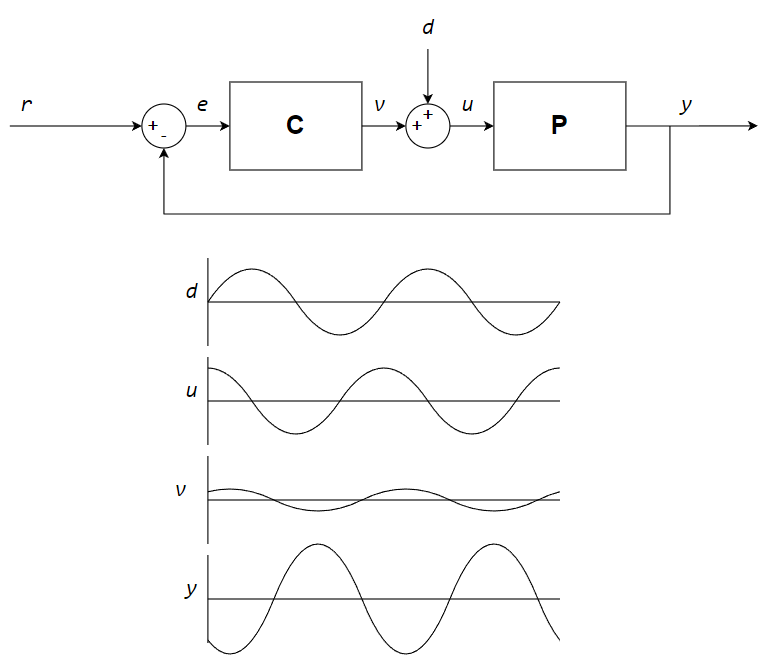
Shared between the Servo Tuning guide, Glossary, and Help file.A frequency response lets you make an analysis of the dynamic behavior of the servo loop in the frequency domain. You can also make an estimate of how changes to the servo parameters will have an effect on that behavior.Before you use the Frequency Response module, the axis that you select must be stable. To measure the frequency response, the controller injects a known disturbance (d) into the servo loop and measures the response of the other signals in the servo loop. When the controller injects a sinusoidal disturbance into the servo loop, all of the other signals in the loop become sinusoids that have the same frequency as the disturbance. But these signals will have a different amplitude and time delay.
The controller calculates an input signal and an output signal for one oscillation frequency (ω) by using the equations that follow:
Where:
Input is the input signal for one oscillation frequency (ω).
Ain is the amplitude of the input signal.
ω is the oscillation frequency.
t is the time.
θin is the phase of the input signal.
Where:
Output is the output signal for one oscillation frequency (ω).
Aout is the amplitude of the output signal.
ω is the oscillation frequency.
t is the time.
θout is the phase of the output signal.
The Frequency Response module automatically measures the related signals and calculates a magnitude and phase angle for each response type along the user-defined frequency range. This type of calculation results in a frequency response plot, which is also called a Bode plot.


