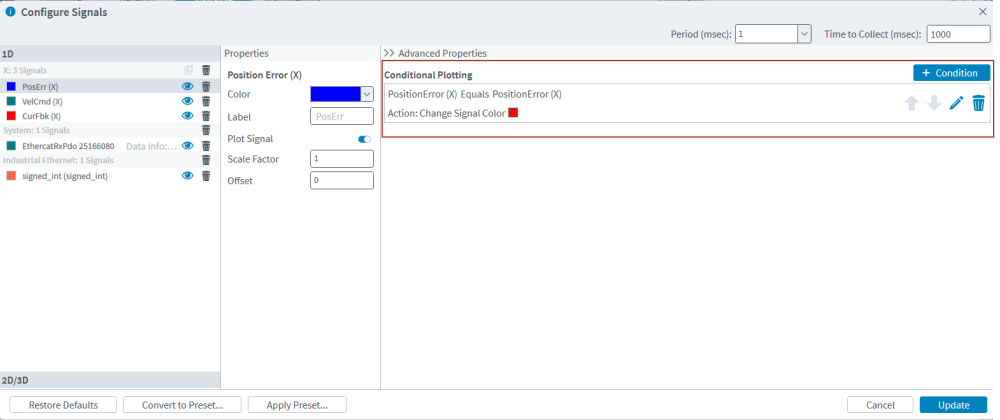
Conditional Plotting
Use conditional plotting with data collection to apply visual effects to parts of a plot signal when the conditions you defined are met. For example, if you are collecting the Position Error (X) signal, which is blue by default, you could add a condition that changes all points higher than the specified value to red.
You can define conditions for 1D, 2D, and 3D line plots. Conditions can use the signals that you added to your data collection configuration. For example, you can add a condition to the Position Feedback (X) signal that uses the Position Error (X) signal if you added both to your data collection configuration.

Table: Configure Signals Dialog - Data Collection Presets
| Name | Type | Description |
|---|---|---|
| Conditional Plotting | List | Displays all of the conditions that are configured for the selected signal |
| + Condition | Button | Adds a new condition to the selected signal |
| Up Arrow | Button | Moves that condition up in the list |
| Down Arrow | Button | Moves that condition down in the list |
| Edit Condition | Button | Edit the properties of that condition |
| Delete Condition | Button | Delete that condition |
-
In the Data Visualizer module, click the Configure Signals link.
-
Expand the Advanced Properties panel on the right side of the dialog. The conditions for the selected signal will show.
-
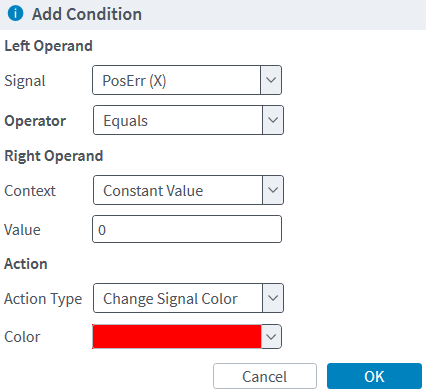
Click the + Condition button. The Add Condition dialog comes into view.
-
Use the dialog to select the information that you want to compare, how to compare it, and what action to take when the condition is met.
-
Use the Signal drop-down to select which signal is the left operand.
-
Use the Operator drop-down to select how the information is compared.
-
Use the Context drop-down to select if the right operand is a constant value or a signal.
-
If you select Constant Value, set a value in the Value box. If you select Signal, use the Signal drop-down to select the signal.
-
-
In the Action section, select the action in the Action Type drop-down.
-
If you are changing the signal color, select the color from the Color drop-down.
-
-
-
Click the OK button.
If you have more than one condition for a signal, the first one in the list that evaluates to true is the one that will show on the plot. You change the order of the conditions with the Up and Down arrows in the list of conditions.
You can configure conditional plotting in all the same places that you can configure data collection in Automation1 Studio, including the Configure Signals dialog, Edit Plot dialog, the Data Collection Presets module, and when defining a MachineApp that uses the Data Visualizer.


